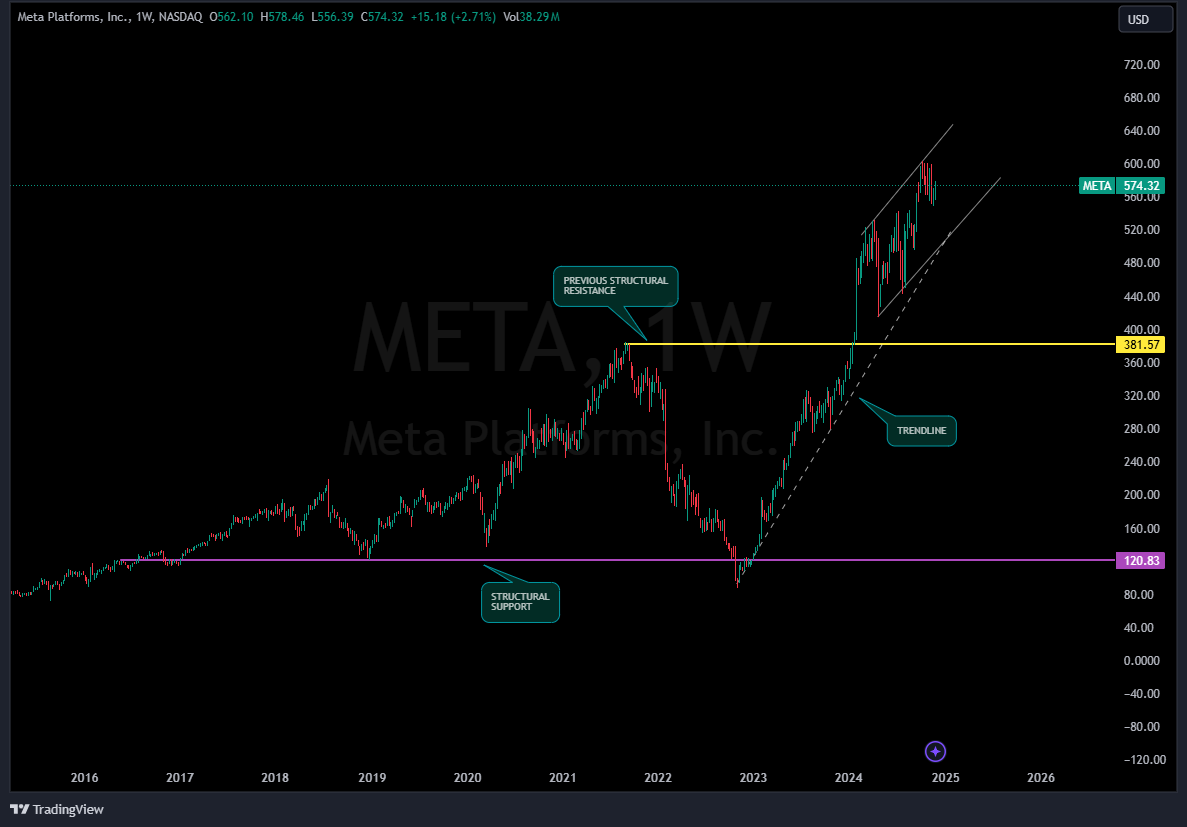
A price chart is a graphical representation of the historical prices of a security, commodity, or currency over a specific period. It’s a tool used to visualize and analyze market trends, patterns, and fluctuations. The trends may be bullish (rising prices) or bearish (falling prices).
Price charts typically display the following information:
Common types of price charts include:
Price charts are essential tools for traders, investors, and analysts. It is a tool that can help in Identifying trends and patterns, therefore enabling an analysis of market sentiment to make informed investment decisions and monitor trading strategies. They are typically the primary tool for Technical Analysts.
An example of a price chart is one above for Meta Platforms Inc. listed on the NASDAQ exchange. On it we can see some basics that: